

Why your input metrics dashboard beats any output report
The only metrics worth obsessing over are the ones you can change.

Most marketing dashboards measure what already happened. They show you clicks, conversions, rankings, revenue. All outputs. All things you cannot directly control. If the numbers are bad, you stare at them and try to figure out what went wrong. If they’re good, you’re not sure what to repeat.
Input metrics dashboards flip this. They track the work that produces the results, not the results themselves. And once you make that shift, you start managing your marketing the same way a serious athlete manages a training program.
The gym analogy nobody in marketing talks about
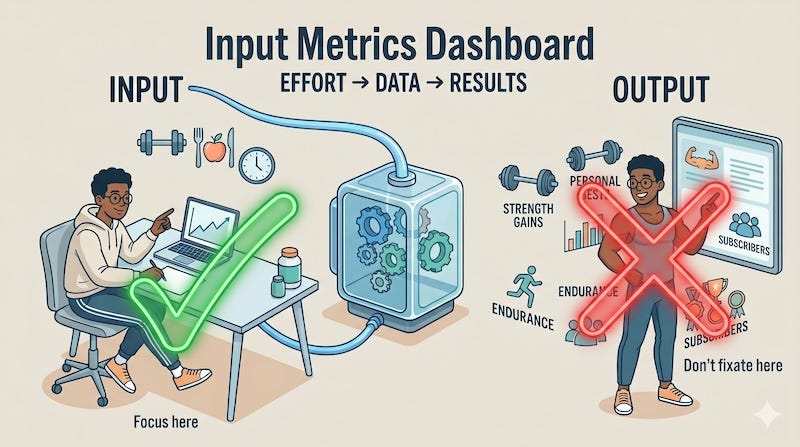
Imagine you want to get stronger. You could obsess over your bicep measurement every morning. Step on the scale daily. Track your body fat percentage with precision. None of that tells you what to change in your training.
Or you could track how often you go to the gym, which exercises you do, how many sets, how much weight. Now you have something to work with. You see a plateau, you adjust the inputs. You see progress, you know what drove it.
Marketing works the same way. The output metrics (traffic, leads, revenue) are the bicep measurement. The input metrics (how many articles published, how many industry publication pieces submitted, how many distribution steps executed per piece) are the workout log.
Most dashboards skip the workout log entirely.
What makes input metrics different
Input metrics track what you can actually control.
You cannot control whether a piece of content ranks on page one. You can control whether it gets written, edited, published, and distributed properly. You cannot control whether a Facebook group post gets seen by thousands of people. You can control whether you show up in those conversations consistently, week after week.
This matters even more in an AI-driven environment. When AI models are deciding which brands to cite, which experts to reference, which content to surface in an AI Overview, the output is increasingly unpredictable. What you can control is the quality and consistency of what goes in. Garbage in, garbage out. The input is the lever.
Waikay is building specifically around this idea: analyzing what feeds into AI systems, helping optimize content structure, entity connections, and the data that influences how models represent your brand. That is input optimization at the AI layer.
The execution gap that kills most strategies
Here is something that almost never gets discussed in marketing strategy conversations.
The gap between “we decided to do this” and “this actually got done” is enormous. Most marketing strategies fail not because the ideas were bad, but because execution was inconsistent.
It is one thing to say you want to build a content library of 100 articles. It is something entirely different for those articles to get written, reviewed, published on the website, and distributed across channels. The sad reality is that a huge percentage of content briefs, strategy documents, and content calendars end up sitting in a Google Drive folder for months. Eventually, they become irrelevant. Nobody tracks that this happened, so nobody fixes it.
An input metrics dashboard forces the question: did this actually get done?
Did the article get published on the site or is it still in the folder? Did the distribution checklist get completed or did we just hit publish and move on? Did the guest post for the industry publication get submitted this month or did it slip again?
These are uncomfortable questions. That is exactly why they are valuable.
The Search Everywhere Optimization Pyramid is an input problem
The Search Everywhere Optimization Pyramid is a framework I use with clients to structure visibility across every platform where their audience searches, not just Google.
The pyramid has five layers: audience platform research, alert system, industry publications, distribution, and your own content channels. Each layer has to be built and maintained.
The moment you start managing this seriously, you realize it is almost entirely an input tracking problem.
Take the industry publications layer. The idea is to contribute regularly to established publications in your space. For my agency SEOLeverage, that means writing for Search Engine Land. Contributing to a leading media outlet in your industry gives you third-party credibility that your own blog simply cannot replicate. When a prospect checks you out and sees your byline on a well-known industry publication, the dynamic changes. On top of that, established outlets have their own distribution layer already set up which every contribution of yours will leverage to reach more people.
But “write for industry publications” as a strategy only works if you actually do it consistently. One article every six months produces almost no compounding effect. Consistent contribution, tracked and measured as an input, produces credibility that builds over time.
Same with the distribution layer. Every piece of content you create should go through a defined distribution process. When we publish something, the process might include creating a video about it, writing social posts and scheduling them multiple times, writing a related piece for Search Engine Land, republishing on Medium, running paid ads on Meta, and writing a version of it here on Substack.
That is a lot of steps. And every one of them is an input. If you are not tracking whether they happen, most of them quietly stop happening. The distribution layer collapses, and you wonder why content is not performing.
The attribution trap and why it makes dashboards dangerous
There is a deeper problem with output-only dashboards, and some of the smartest people in marketing have been making this point for years. Marketers like Rand Fishkin, Amanda Natividad, or Tim Soulo have all written and spoken about this. The problem is simple: not everything can be tracked. And the things that cannot be tracked are often the most impactful:
What is the value of a reply you wrote in a Facebook group three years ago that has now been seen by hundreds of thousands of people?
What is the value of a YouTube live session where thousands of people first encountered your thinking and now associate your name with a specific way of solving a problem?
What is the value of appearing in a list of vendors that a prospect compiled during their research phase, two years before they were ready to buy?
None of these show up cleanly in your analytics.
What typically happens is that someone eventually searches your brand name, finds your site, and converts. Google Analytics records it as organic search or direct traffic.
The Facebook post from three years ago, the YouTube video, the industry publication byline that put you on their radar in the first place: gone. Invisible.
This is last-click attribution at work. The dashboard only sees the final step. It misses the entire journey that made that final step possible.
The response to this is not to stop measuring. It is to stop pretending that the things you can measure are the only things that matter. An input metrics dashboard acknowledges reality: you cannot always track the impact, but you can always track whether the work happened.
What an input metrics dashboard actually tracks
The specifics depend on your strategy, but here is how I think about it across the layers of the pyramid:
Audience and alert layer: How many alerts are active? How many conversations did you engage with this week? How many relevant threads did you reply to?
Industry publications layer: How many submissions this month? How many pieces published in external publications year to date? Is the submission cadence consistent with the target?
Distribution layer: For each piece of content published, how many distribution steps were completed? Video created: yes or no. Social posts written: yes or no. Scheduled for republishing: yes or no. Industry publication version submitted: yes or no.
Your own content channels: Articles published to the site versus sitting in draft or in a folder. Substack posts published. Videos uploaded. Reddit threads contributed.
None of these are vanity metrics. They are the leading indicators. Output metrics are lagging indicators. By the time the output metrics tell you something is wrong, you are already months behind.
The practical shift
This is not complicated to start. You do not need a sophisticated tool. A simple spreadsheet tracking what you committed to doing each week and whether it happened is enough to begin.
The harder part is the mindset shift. Most marketing reporting is built to justify past decisions, not to improve future inputs. When you start tracking inputs honestly, you often discover that the brilliant strategy from last quarter was only half-executed. That is uncomfortable. It is also the most useful information you can have.
Track what goes in. Optimize what goes in. The outputs will follow.
That is what an input metrics dashboard is actually for.